If you have a tech job and live outside of California, it’s likely you have considered moving to the center of the tech world - Silicon Valley or San Francisco. A quick look at the job search sites shows you’ll be making the big bucks! But before you accept that $120,000 salary make sure you take a close look at housing costs.
The interactive chart below provides details on just how expensive San Francisco single family homes are. The chart breaks down the single family home sales by Median Sales Price, Minimum Income Required, Average Sales Price, Average Sales Price Per Square Foot, Average Square Footage and Number of Sales all by neighborhood and year (10 years of data).
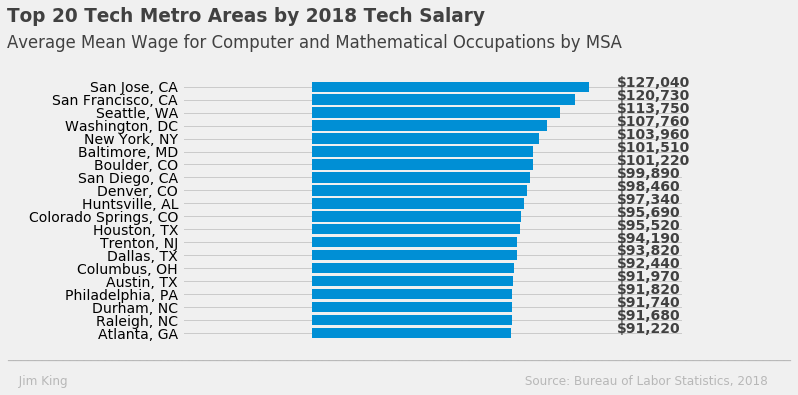
Let’s compare San Francisco with the top 20 tech metro areas (MSAs) in the U.S. based on highest average mean wage for computer and and mathematical occupations.
Now let’s take those 20 tech metro centers and rank them by the 2018 Housing Differential. The Housing Differential takes the average mean wage of a tech worker and subtracts income needed to buy a single family home. For example, a San Francisco tech worker makes $120,730 on average but needs $133,731 in income to buy the median home - so the worker needs $13,001 more in salary to buy a home!
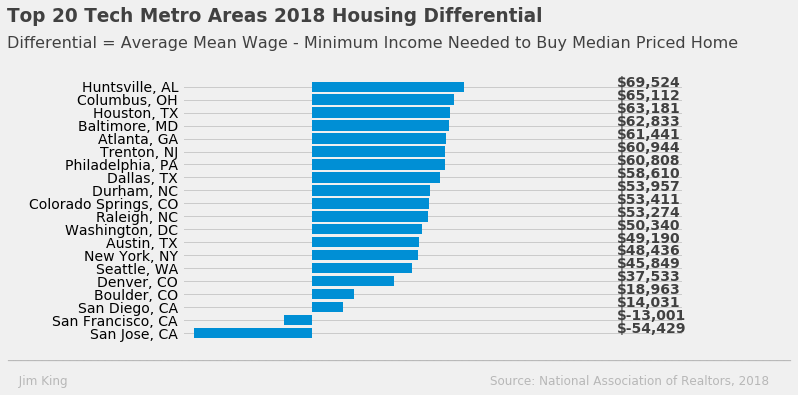
As you can see San Francisco and Silicon Valley (San Jose Metro Area) show a negative housing differential. In other words, your big tech salary won’t cover the mortgage!
Where does your tech salary go the furthest? You may be surprised to find it’s Huntville, Alabama where nearly 4,000 aerospace engineers work for companies such as Boeing and Blue Origin. It has relatively high salaries compared to housing prices. A tech worker in Huntsville makes on average $97,340 yet only needs $27,816 to buy the median priced home.
This article was published on Towards Data Science on September 2, 2019 and can be viewed here.
This is Part 1 of a Series of Articles Exploring San Francisco Real Estate Data
San Francisco Real Estate Data Source: San Francisco MLS, 2009-2018 Data
Salary Data: Bureau of Labor Statistics - Occupational Employment Statistics, 2018 Data
National Median Single Family Home Sales Price Data: National Association of Realtors, 2018 Data
Minimum Income Required - Uses the California Association of Realtors Housing Affordability Index - Traditional Methodology. It uses median price, 20% down payment, monthly house payment based on annual 4% interest rate, 1% tax rate and .38% insurance rate, and assumes no more than 30% of household income can be used for housing payment.