You’ve done the data science, now you need to present the results to the world! Dash is a python framework for building web applications. Written on top of Flask, Plotly.js and React.js, Dash is well-suited for quickly building customized web applications. Once built, the web application can easily be deployed on a cloud platform such as Heroku.
Let’s start with the final product. The simple web app below (or at this link Multiple Offer Calculator) enables the user to determine the predicted price to pay for a home facing a bidding a war. The predicted price is based on historical data from 2015 - 2019 for all single-family homes sold in Marin County, CA receiving two or more offers. The user can select the area, number of bedrooms, number of baths, number of expected offers and listing price and the app will provide the predicted sales price.
To use the web app simply select the Predict tab, select the criteria and the app will return the predicted offer price. For an explanation of the goals, data, evaluation protocol and model selection use the Explain tab. The Evaluation tab provides metrics used to evaluate the accuracy of the predictions versus the actual winning offers.
If you’d like to understand how to develop your own interactive web app follow along as I step you through the process.
A Word About the Code
All the code, data and associated files for the project can be accessed at my GitHub. After installing Dash, run the code on your local computer from the the directory the code resides in and in your terminal run python app.py. This will run the app on your local host (127.0.0.1:8050).
The Data Science
As this article is focused on the creation of an interactive web app, I will briefly describe the data science used to predict the optimal bid price. For details take a look at the colab notebook here.
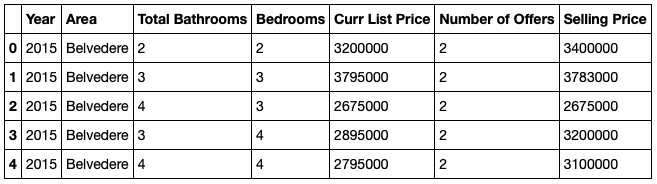
The raw data is historical data from 2015 - 2019 for all single-family homes sold in Marin County, CA receiving two or more offers. After importing the raw data and mapping the areas to their city names, the data looks like this:
The data was divided into training (2015 - 2017) with 2,973 sales, validation (2018) with 991 sales and test (2019) with 776 sales. The test set contains about 11 months of data from 2019.
# Split into train and test - 2015-2018 in train, 2019 in test
low_cutoff = 2015
high_cutoff = 2019
train = df[(df['Year'] >= low_cutoff) & (df['Year'] < high_cutoff)]
test  = df[df['Year'] >= high_cutoff]

# Split train into train and validation - 2015-2017 in train and 2018 in validation
cutoff = 2018
temp=train.copy()
train = temp[temp['Year'] < cutoff]
val  = temp[temp['Year'] >= cutoff]
A simple linear regression was initially run with excellent results. An XGBoost model was then run and had slightly better metrics and was therefore selected as the model.
| Validation | Test | |
|---|---|---|
| MAE | $71,851 | $68,002 |
| R-Squared | 0.9726 | 0.9839 |
Pickling
Pickling is used for serializing and de-serializing Python objects (also referred to as marshalling or flattening). Pickling is very useful when working with machine learning algorithms when you want to save the process in order to make predictions at a later time without having to re-train your model. In our case, we are going to pickle the pipeline and use it in our web app for making predictions.
First we import dump from joblib:
from joblib import dump
Next we run the XGBoost model and dump the pipeline. This essentially saves the pipeline to a file named pipeline.joblib on our local disk. This file is then loaded into GitHub and used in the predict.py code in the web app.
# Encode and fit a XGBoost model
target = 'Selling Price'

features = train.columns.drop(target)
X_train = train[features]
y_train = train[target]
X_val = val[features]
y_val = val[target]
X_test = test[features]
y_test = test[target]

pipeline = make_pipeline(
    ce.OneHotEncoder(use_cat_names=True),
    XGBRegressor(n_estimators=200, n_jobs=-1)
)

pipeline.fit(X_train, y_train)
dump(pipeline, 'pipeline.joblib')
y_pred = pipeline.predict(X_val)
The Dash App
Dash apps are composed of a “layout” defining the look of the app and “callbacks” creating the interactivity. Our basic Dash app is composed of the app.py and the index.py files. If you have used Flask, then this code will look very familiar!
app.py
import dash

external_stylesheets = ['https://codepen.io/chriddyp/pen/bWLwgP.css']

app = dash.Dash(__name__, external_stylesheets=external_stylesheets)
app.config.suppress_callback_exceptions = True
server = app.server
The app.py file simply initializes and instantiates the Dash app.
index.py
from dash.dependencies import Input, Output
import dash_core_components as dcc
import dash_html_components as html

from app import app, server
from tabs import intro, predict, explain, evaluate

style = {'maxWidth': '960px', 'margin': 'auto'}

app.layout = html.Div([
    dcc.Markdown('# Multiple Offer Calculator'),
    dcc.Tabs(id='tabs', value='tab-intro', children=[
        dcc.Tab(label='Intro', value='tab-intro'),
        dcc.Tab(label='Predict', value='tab-predict'),
        dcc.Tab(label='Explain', value='tab-explain'),
        dcc.Tab(label='Evaluate', value='tab-evaluate'),
    ]),
    html.Div(id='tabs-content'),
], style=style)

@app.callback(Output('tabs-content', 'children'),
              [Input('tabs', 'value')])
def render_content(tab):
    if tab == 'tab-intro': return intro.layout
    elif tab == 'tab-predict': return predict.layout
    elif tab == 'tab-explain': return explain.layout
    elif tab == 'tab-evaluate': return evaluate.layout

if __name__ == '__main__':
    app.run_server(debug=True)
The index.py file is the main executable for the app. It is divided into two main components: the layout and the callback. Let’s look at the layout first.
The Layout
Dash provides two sets of visual components: dash_html_components and dash_core_components. The dash_hml_components library has a component for every HTML tag. The dash_core_components library are higher-level components such as tabs, dropdowns, markdown blocks, graphs and more.
For the layout of our app, we are going to keep it simple using html.Div, dcc.Markdown and dcc.Tab. The app.layout defines our layout and within the html.Div (defines a section in an HTML doc) the dcc.Markdown creates the title using Markdown and the dcc.Tab creates four tabs with the label visible in the tab and a value to use in the coding. That’s it - we’ve essentially created the home page!
The Callback
Dash uses the @app.callback decorator to tell the app how to handle the inputs and outputs. In our app, the input is the id=’tabs’ defined in the layout dcc.Tabs with four children - Intro, Predict, Explain and Evaluate. The output is the id=’tabs-content’ defined in the html.Div. When a user clicks on a tab, the input identifies the tab, the render_content(tab) constructor (function) is called changing the tab to the clicked tab and then the results are output to html.Div. That’s it - a very simple callback!
The Predict Tab
With the basics down, let’s take a look at a more complex example with our Predict tab. In the predict.py code we are going to use a dropdown and four slider tabs to obtain our input for our prediction. The input will then be used to run our pickled prediction and output the results.
style = {'padding': '1.5em'}

layout = html.Div([
    dcc.Markdown("""
        ### Predict
        Use the controls below to update your predicted offer, based on city,
        beds, baths, number of offers, and list price.
    """),

    html.Div(id='prediction-content', style={'fontWeight': 'bold'}),

    html.Div([
        dcc.Markdown('###### Area'),
        dcc.Dropdown(
            id='area',
            options=[{'label': city, 'value': city} for city in cities],
            value=cities[10]
        ),
    ], style=style),

    html.Div([
        dcc.Markdown('###### Bedrooms'),
        dcc.Slider(
            id='bedrooms',
            min=1,
            max=7,
            step=1,
            value=3,
            marks={n: str(n) for n in range(1, 7, 1)}
        ),
    ], style=style),

    html.Div([
        dcc.Markdown('###### Baths'),
        dcc.Slider(
            id='baths',
            min=1,
            max=9,
            step=1,
            value=2,
            marks={n: str(n) for n in range(1, 9, 1)}
        ),
    ], style=style),

    html.Div([
        dcc.Markdown('###### Number of Offers'),
        dcc.Slider(
            id='offers',
            min=2,
            max=15,
            step=1,
            value=3,
            marks={n: str(n) for n in range(2, 15, 1)}
        ),
    ], style=style),

    html.Div([
        dcc.Markdown('###### Listing Price'),
        dcc.Slider(
            id='list_price',
            min=1000000,
            max=3000000,
            step=100000,
            value=1500000,
            marks={n: f'{n/1000:.0f}k' for n in range(1000000, 3000000, 100000)}
        ),
    ], style=style),

])


@app.callback(
    Output('prediction-content', 'children'),
    [Input('area', 'value'),
     Input('bedrooms', 'value'),
     Input('baths', 'value'),
     Input('offers', 'value'),
     Input('list_price', 'value')])
def predict(area, bedrooms, baths, offers, list_price):

    year = 2019
    df = pd.DataFrame(
        columns=['Year', 'Area', 'Total Bathrooms', 'Bedrooms', 'Curr List Price', 'Number of Offers'],
        data=[[year, area, baths, bedrooms, list_price, offers]]
    )

    pipeline = load('model/pipeline.joblib')
    y_pred_log = pipeline.predict(df)
    y_pred = y_pred_log[0]
    percent_over = ((y_pred - list_price) / list_price) * 100
    per_offer = percent_over / offers
    results = f'The predicted winning bid is ${y_pred:,.0f} which is {percent_over:.2f}% over the asking price or \
                {per_offer:.2f}% per offer.'

    return results
While this may look like a lot of code it is really very simple. The layout is composed of only four components - html.Div, dcc.Markdown, dcc.Dropdown, and dcc.Slider. Our layout consists of six html.Div (sections) with the prediction in the first section and the components in the next five. The five components provide the input.
The callback is called whenever any single input is changed calling the predict function and outputing the results to the first section.
Notice in the prediction function that pipeline = load(‘model/pipeline.joblib’) loads the dumped pipeline allowing predictions to made very quickly using very little code.
This provides a very brief introduction to Dash. For more details take a look at the Dash documentation here.
Heroku Deployment
Once you get the interactive web app working locally, you can let others access it by using a public hosting service such as Heroku. Heroku will host the app allowing you to link to it or use an iframe (as in this article).
The basic steps to host on Heroku are:
-
Create a Procfile and requirements.txt file. See mine in my GitHub.
-
Create a Heroku app and connect to your GitHub repository.
-
Run the app!
Marin Real Estate Data Source: Marin MLS (BAREIS), 2015-2019 Data